We live in the age of analytics. Today’s most successful organizations see the ability to make data-driven decisions based on business intelligence as their biggest competitive advantage.
In our 2022 Productivity Report, we found that 86% of leaders believe digital transformation efforts have accelerated as a result of COVID-19. When you are building out digital capabilities, measuring business value is critical. However, demonstrating this return on investment is not without challenges.
Here’s the good news: Nitro Analytics provides the insights you need to measure and optimize performance. Not only is it a powerful differentiator for your business, there’s no other solution like it on the market.
A Competitive Edge For Your Business
The Nitro Productivity Platform is a high-trust, secure solution built for collaboration across Nitro PDF Pro, Nitro Sign, Nitro Analytics, Document Generation and Identity Services. It helps maximize productivity, improve collaboration and build efficient workflows across all stages of the document lifecycle.
As part of the platform, Nitro Analytics brings several extended advantages to your organization.
Key Benefits of Nitro Analytics
- Increase Visibility: Access rich, real-time data and analytics across Nitro PDF Pro & Sign in one streamlined, easy-to-use solution.
- Get Actionable Business Intelligence and Insights: Identify trends, measure the success of digital transformation initiatives and demonstrate return on investment to stakeholders.
- Improve Decision Making: Leverage Nitro’s recommendations to drive business efficiency and pinpoint opportunities for growth.
- Build Agility: Empower teams to adapt to change, navigate challenges and prepare for the future.
Continuous Innovation
Nitro’s 2022 Summer Release adds even more power to Nitro Analytics and the business insights it can provide.
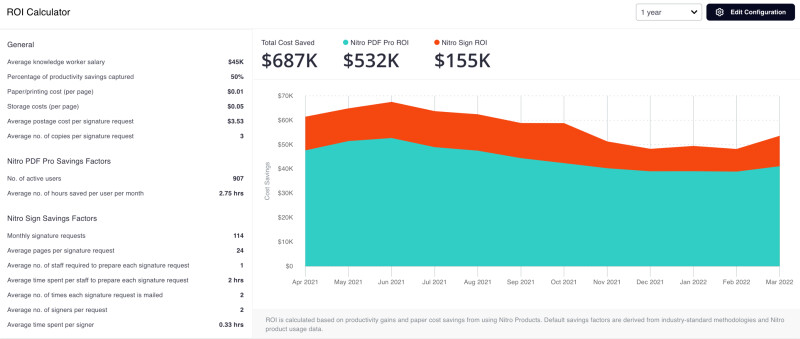
In addition to the enhanced dashboards for Nitro PDF Pro and Nitro Sign, we’ve added a brand new ROI dashboard with a host of valuable features:
- Quantify return on investment with the ROI Calculator tool
- Capture paper, cost and time savings from eSigning
- Calculate organizational efficiency with the Productivity Score
- Visualize the environmental impact of your activities
Want to see these updates in action? Watch this quick overview video on Nitro Analytics.
Make Strategic Decisions Based on Strong Business Intelligence
Let’s say your business has invested in Nitro’s Productivity Platform to deliver seamless digital document experiences. Now, how do you know if your users are taking full advantage of everything Nitro offers? How do you know your investment is delivering expected returns? Nitro Analytics helps you measure it automatically.
Let’s dive into some frequently asked questions:
1. How can I demonstrate Nitro’s return on investment to stakeholders?
Visualizing your business landscape couldn’t be easier. Nitro's ROI dashboard takes information from the Nitro PDF Pro and Sign dashboards and calculates the potential cost savings for the organization. You can view an estimate of your return on investment based on usage and industry standards. You’ll have the flexibility to further edit the configuration to customize ROI calculations and provide more accurate figures. Data is available instantly, so you can analyze and share it with stakeholders in a matter of minutes.

You can also see paper and hours saved from eSigning.

2. How are productivity insights shared in Nitro Analytics?
The health of your organization can be viewed as a single Productivity Score calculated across five core components.
- License Utilization
- Usage Frequency
- PDF Productivity
- eSigning Usage
- Print Reduction
Nitro Analytics only collects anonymized accounts to protect individual users and doesn’t access or record personal data.

3. My business has a long-term sustainability strategy. Can I show how I’m contributing to these goals?
Yes! As well as seeing the amount of paper saved by eSigning, you can view the environmental impact of your activities across key indicators:
- Number of trees saved
- BTUs of energy saved
- Pounds of CO2 emissions prevented
- Species saved from extinction

4. I want to increase product adoption across my teams. How can I do this?
With the Nitro PDF Pro business intelligence dashboard, you can get an in-depth look at how the product is being used across your business.
- The Feature Adoption section shows exactly how many users access the tool and what features are used most frequently.
- The Version Distribution Graph ensures users are up to date with PDF Pro, so you can be confident your team is getting the best experience possible.
These analytical insights can help you identify opportunities for product training and further learning, as well as how to build more connected workflows across your business.

It's Time to Future-Proof Your Business
Nitro Analytics is built to take your performance to the next level. Get in touch to ask any questions, discuss a free trial for your business, or experience Nitro with a personal demonstration.

